Dear CAPRA users, in this publication we intend to present you three softwares designed to evaluate hazard due to different hydrometeorological phenomenon. For each of them, you can find a complete User Manual that contains the theoretical framework required in their development, and a step by step tutorial for a complete understanding of practical applications. The software, created by the technical and scientific engineering company ITEC in conjunction with the CAPRA team, can be downloaded for free in the links shown below.
| Software | Description | Results | Limitations |
|---|---|---|---|
| IT-Precipitation | Completeness analysis of precipitation data and generation of annual, monthly and daily statistical charts. | Annual, monthly and daily graphs that can be edited in Excel | Only admits precipitation data in the period between 1960 and 2025, and doesn’t complete missing data. |
| IT-NHRain | Generation of Depth-Area-Duration-Frequency (DADF) curves from historical records and generation of stochastic elliptical storms for evaluation of rain hazard. | Basin’s DADF curves information and hazard file * .AME (compatible with CAPRA) with stochastic storms | Generation of maximum 20 stochastic storms per return period |
| IT-Flood | Simulation of flood events by three possible hydrological methods: HEC-HMS connection, triangular unit hydrograph and hydrometric frequency analysis. HEC-RAS routes the hydrographs and generates the stochastic flood events. | Flood hazard file * .AME with the stochastic scenarios | Simulation of 20 flood scenarios. |
*for more capacity please contact us via email: ecapra@uniandes.edu.co
Click for more detailed information in each software.
![]()
![]()
![]()
IT-NHRain
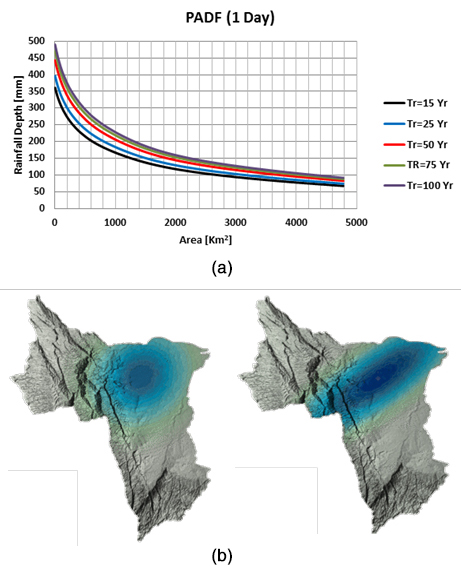
The main purpose of this software is to evaluate hazard due to non-hurricane rain. It is based on ERN-HNRain, developed by ERN-AL. IT-NHRain allows users to generate Depth-Area-Duration-Frequency (DADF) curves based on records of precipitation in watersheds’ stations From these curves, IT-NHRain creates a set of stochastic elliptical storms located randomly over the basin, altogether they represent the rain hazard of the area. As a result, a *.AME file, compatible with the CAPRA-GIS platform, is obtained. All the applications described are fully integrated in this new tool and the results serve as an input for the evaluation of secondary hazards such as flood or landslide. Furthermore, it can be used directly for flood hazard evaluation in the IT-Flood software.
Results: The main results is a graph that contains curves relating precipitation depth, area, duration and frequency, and an AME file containing rain stochastic scenarios.
IT-Flood:
This software uses a probabilistic analysis to create stochastic flood scenarios. Intensity parameters and their associated expected occurrence, derived from hydrological and hydrodynamic models, are required for the definition of flood hazard in a particular area. Hydrological models, on one side, are based on precipitation-runoff interactions, where an excessive relation implies flood occurrence. Hydraulic models, on the other side, are based on detailed information of tributaries rivers such as their slope and transversal section, among other characteristics. This software has three different hydrological estimation methods: HEC-HMS method, triangular unit hydrograph (TUH), and hydrometric frequency analysis method. The hydraulic modeling is performed by HEC-RAS, who yields information related to depth, mean velocity and duration. The general results can be introduced in CAPRA-GIS, in order to assess flood risk, as well as its analysis, prevention, and mitigation
Results:
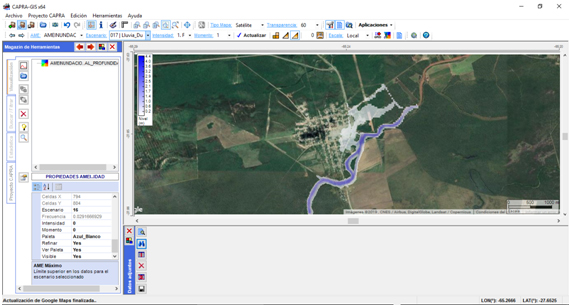
The output file is a hazard file *.AME, containing all the possible intensities, which mainly depends on the hydrological evaluation method.
| Hydrological evaluation method | AME intensities result |
|---|---|
| HEC-HMS | Depth, velocity and duration |
| Triangular Unitary Hydrograph | Depth and velocity |
| Hydrometric frequency analysis | Depth and velocity |
The figure below shows the visualization of an AME flood file in CAPRA-GIS.
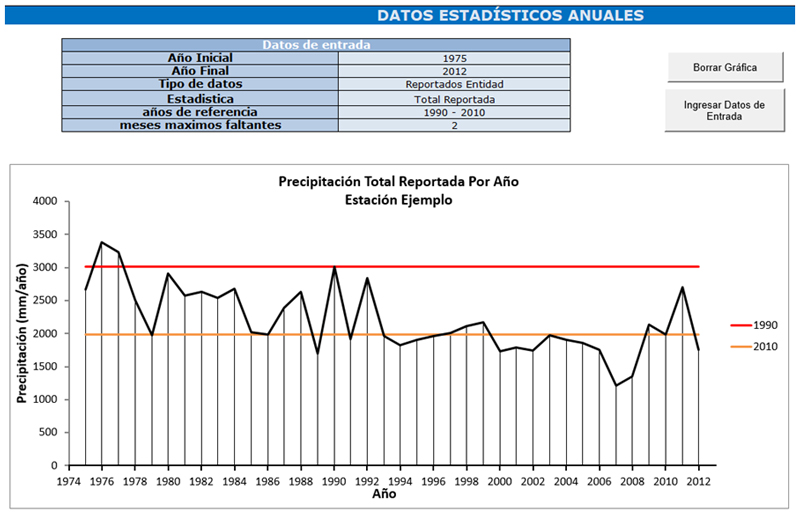
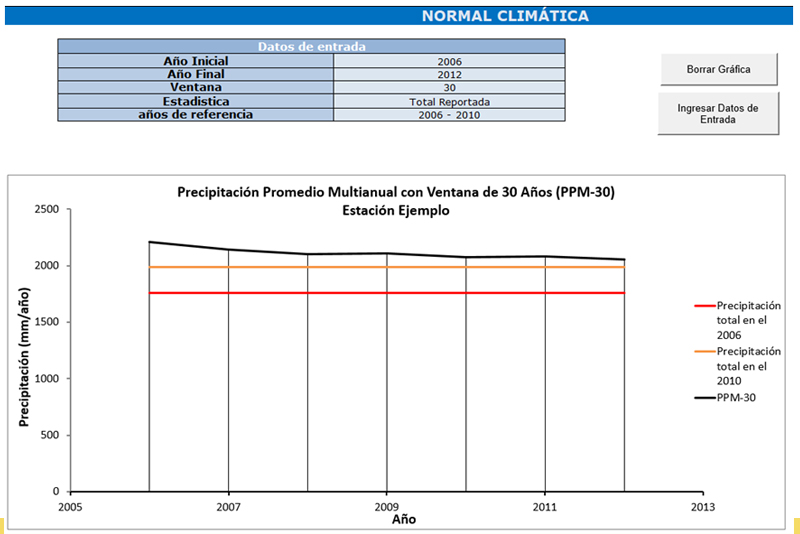
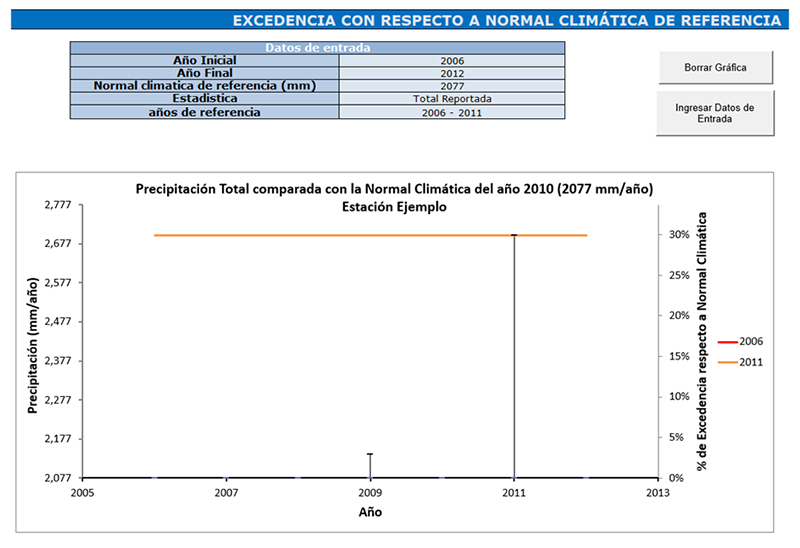
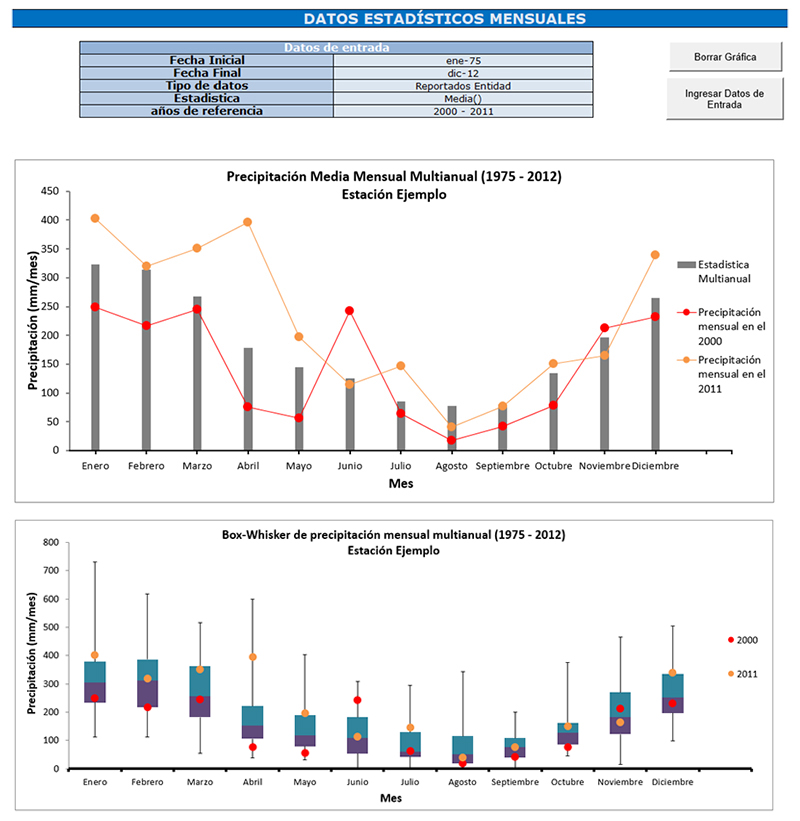
IT-Precipitation
This software interprets available precipitation information, adjusts the formats, elaborates a completeness analysis, and finally generates all the related data statistics. The next flowchart describes de analysis process lead by the software.
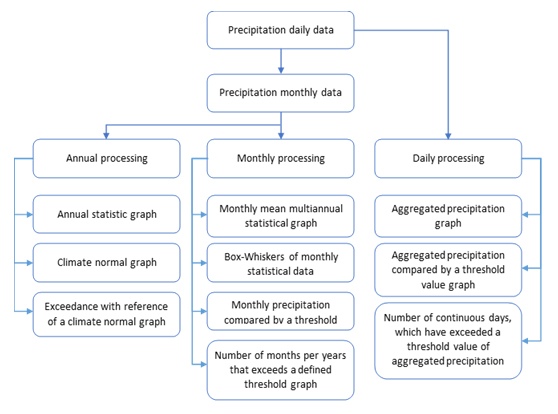
Requirements: Precipitation data (the time scale can be daily, monthly or annual)
Results: Multiple graphics as shown below
Software IT-Precipitation, IT-NH Rain, IT-Flood applied
CAPRA had the honor to participate in two projects for the Inter-American Development Bank (IDB) in which these three software were essential.
Disaster flood risk profile for El Salvador
Local entities from El Salvador, specifically the Ministry of Environment and Natural Resources (MARN), along with the Inter-American Development Bank (IDB) developed the present project in order to carry out a national flood risk assessment through the application of the CAPRA probabilistic risk analysis methodology. For further information of the project visit the next link: (https://ecapra.org/projects/disaster-flood-risk-profile-el-salvador)
In this project IT-flood was used for executing a hydraulic analysis from the results obtained by modelling the geometrical and hydraulic characteristics in the HEC-RAS software. Subsequently, the elevations of the resulting water mirror were automatically extracted, and the depths of water were calculated on each of the points of the cross section. Finally, the program performs the interpolation of the depths and creates a regular mesh in a *.AME format, which contains the flood footprint for each of the scenarios of analysis.
Flood and landslide risk analysis for Bolivia
This project was developed in order to carry out flood and landslide risk analysis including climate change scenarios, for the purpose of establishing recommendations for prevention, mitigation, monitoring systems, financial protection, contingency plans, and emergency attention. For more information on the project visit the next link: (https://ecapra.org/projects/risk-analysis-floods-and-landslides-including-climate-change-scenarios-well-identification)
The hydrodynamic analysis of the project was implemented on the HEC-RAS and IT-Flood programs, in order to perform simulations associated with channels and rivers, among others. For each scenario contained in the rainy *.AME, IT-Flood executes the HEC-RAS program in order to carry out the hydraulic transit of the hydrographs associated with each precipitation scenario, and thus obtain the levels and speeds along the section of study.
The analysis of the rain hazard was carried out with the information available at hydro meteorological stations with registers along the watersheds of interest. In order to develop the hazard model, it was necessary to analyze the rainfall information using the IT-Precipitation software, and then use the IT-NHRain software to generate the Depth-Area-Duration-Frequency (DADF) curves. Later, a set of stochastic events was generated, based on the historical information summarized in the DADF curves. The events are characterized by particular locations and shapes, and from them histograms can be constructed with the purpose of modeling the distribution of the intensity with time. The result is an *.AME file that contains the variability of the fields of precipitation in the basin of analysis.